| |Home |About |Interests |Books |Links |Fun |Photos |Software |Contact | |
imlib-src.rar contains both C++ image libraries and applications, and the newmat11 matrix libraries. See the README file for some of the contents. The distribution is updated sporadically but is fairly up to date. Platforms: windows/Unix/Linux. NOTE 2012-08-09. Functional changes include SAR images thresholding,specklefiltering (G-map) and binary image processing and filtering of sife, elongatedness and bright pixels (sardetect.cpp)
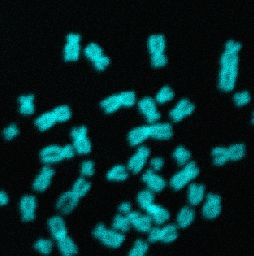
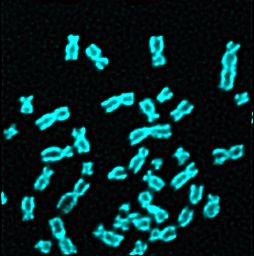
A deblurring example: This is a confocal microscope image depicting chromosomes I picked up from the internet. The first image (256.jpg) shows the raw image, the second image (256_deconv.jpg) shows the image after 10 iterations of Lucy-Richardson (LR) deblurring. In this case the Poisson noise model is particularly useful. In general LR deblurring seems to work well for astronomical images and for pictures with heavy deblurring. For low SNR images more refined regularisation models must be used. In the deconv.cpp program I use here there is a "a-trous" wavelet pyramid noise control built in. This means that wavelet coefficients below a threshold value are discarded in the wavelet reconstruction. Here is a review of deconvolution for optical astronomical images. Here is the script (windows bat file) that does the convolution and which uses the "deconv.exe" program in Imlib. Since I didn't know the deblurring function I assumed a Gaussian with stdv=1.1, a value found after some trial and error.
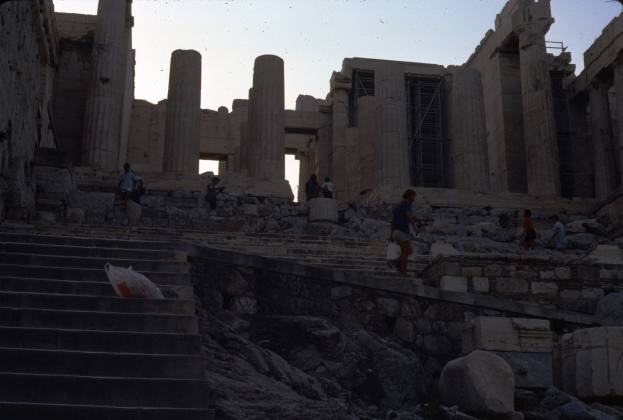
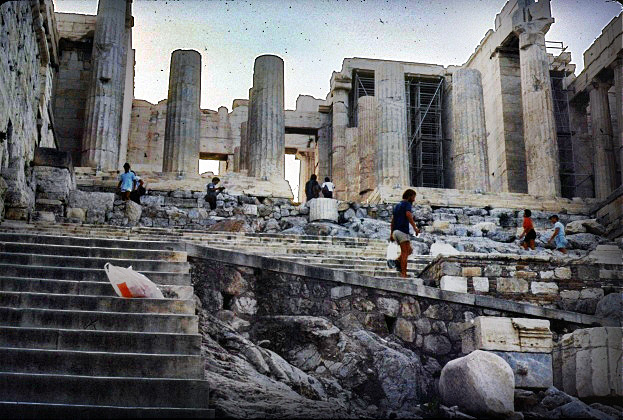
Another appplication is local histogram enhancement. The algorithm implemented here is a version of the CLAHE, Contrast Limited Adaptive Histogram Equalization, which you can also find in OpenCV. The algorithm works by dividing the images into blocks (user defined size). For each block a grayscale transformation function is calculated based on the cumulative histogram for each block. The output grayscale value is then interpolated (bilinear or cubic) over neighbouring pixels. Also, the result is enhanced by dividing the image into a high-pass and low-pass channel, and increase the local high-pass contrast with used-defined constants. An example of this process is show below.
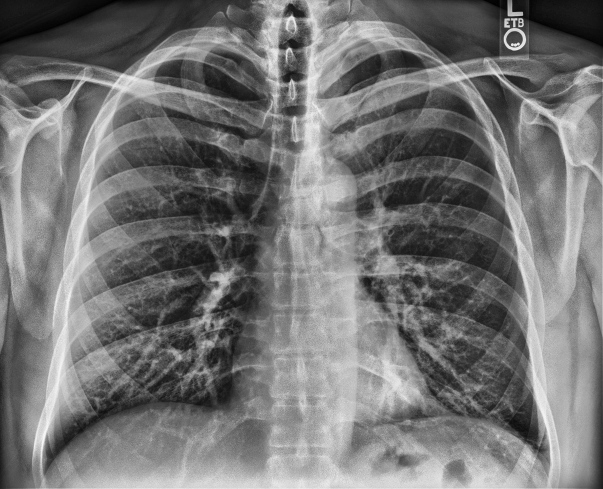
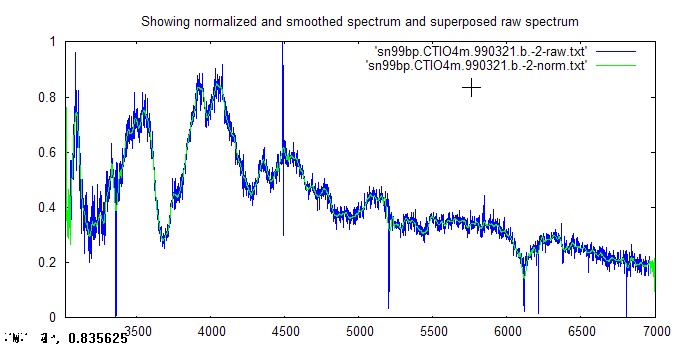
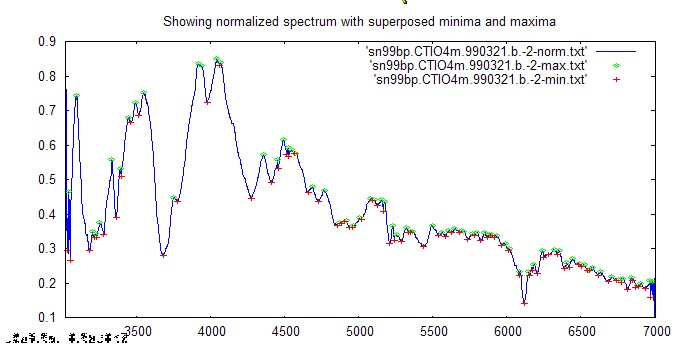
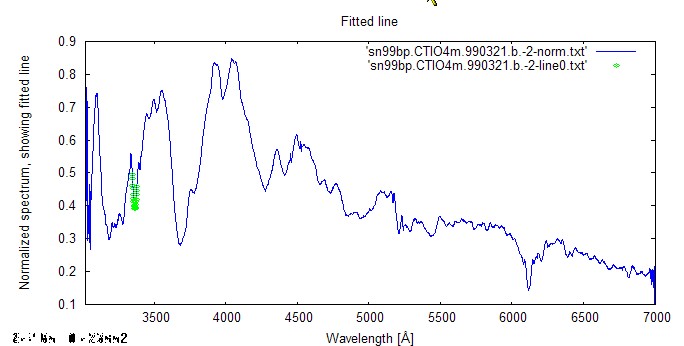
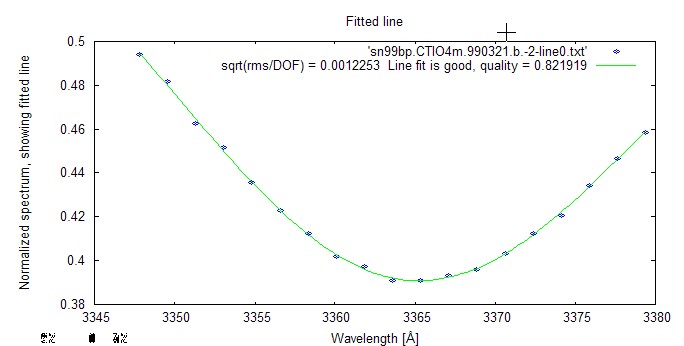
A simple C++ spectral line fitting program adapted for supernova spectra. This is a self contained distribution that also contains the newmat11 matrix library. It does spectral line and Planck curve fitting using a Levenberg-Marquardt procedure with analytical expressions for the jacobian. The spectrum is smoothed using a Savitzky-Golay filter to preserve spectral shapes. The programs automatically finds local maxima and fits a skewed gaussian a * x * exp(-b x^2) to the smoothed data. The output is presented as textfiles and as gnuplot (.dem) files for quick inspection. An example run is shown below. There are three examples of spectra in the distribution and data is generated as text files using a tcsh script and the user can inspect data using gnuplot files.
Platforms: Linux/Unix. Updated 2004-12-21, should now also work for the cygwin environment.
| |Home |About |Interests |Books |Links |Fun |Photos |Software |Contact | |